By Max Minack, BetaShares
With the RBA cutting the official cash rate and announcing further quantitative easing (QE) measures, as well as the dwindling dividend yields on the Australian and global sharemarkets, the hunt for yield has never been so intense. Despite this, there is one source of return that is largely overlooked, and often not understood by investors – roll return.
On Melbourne Cup Day, the RBA cut the official cash rate to an all time low of 0.10% and announced a $100 billion QE program, whereby it purchases government bonds to put further downward pressure on yields. Exacerbating the scarcity of yield, Covid-19 induced lockdowns have created headwinds to corporate earnings, causing dividend yields to fall.
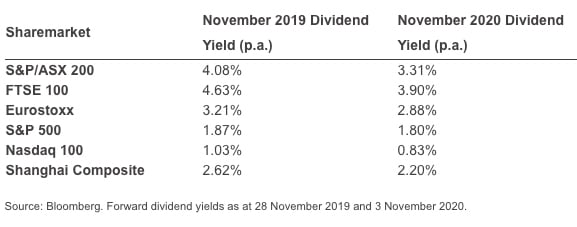
The table below illustrates how sharemarkets around the world have seen dividend yields slump over the last 12 months.
The yields to maturity (often referred to as ‘yield’) of Australian government and investment grade corporate bonds have taken a hit because of the aforementioned reasons, yielding 0.83% and 1.96% p.a. respectively1 – however, yield in isolation does not tell the whole story.
Roll return is an additional source of return that can contribute to the total return from investing in bonds.
What is roll return?
To understand roll return, it is important to recognise that a bond’s yield is the anticipated return on a bond if it is held to maturity. This return comprises:
- the bond’s coupon payments, and
- the capital gain/loss made on the bond i.e. the difference between the bond’s current price and its face value, which will be returned to the bondholder at maturity.
In this calculation, the bond’s price change assumes that any discount or premium to face value is amortised at a constant rate over the remainder of the bond’s life. In reality, bonds are not ‘pulled to par’ in a straight line, and that is why the yield curve is seldom flat and typically slopes upward. Herein lies the opportunity to harvest roll return.
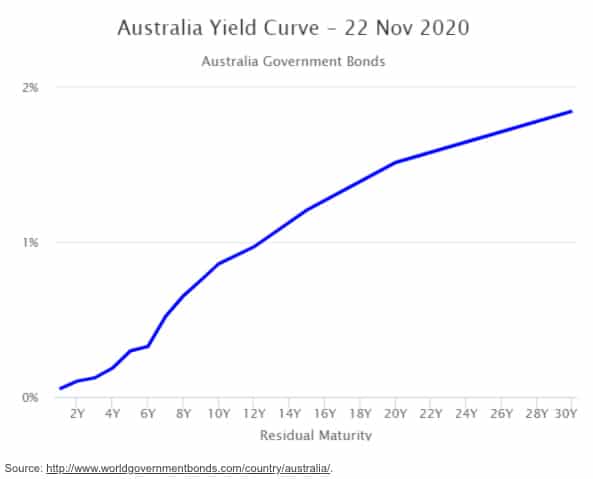
To illustrate this, please refer to the below Australian government bond yield curve:
Based on the above yield curve, the yield on a bond with 10 years to maturity is 0.748% per annum. However, note that the curve is steeper in the 5-10 year section of the curve than the 0-5 year section. Given the price and yield of a bond are inversely related, the bond would be expected to return more in the first five years than in the following five years, assuming the above yield curve remained the same over the relevant period. Of course, it’s important to remember that the yield curve (and therefore the actual return outcome) will vary over time depending on various factors, including interest rates, market conditions, economic growth expectations and monetary policy.
How might investors seek to benefit from roll return?
Let’s look at a zero-coupon bond, where return is dictated solely by price change, since no coupons are paid. Please note the below is a hypothetical example provided for illustrative purposes only, and actual returns may differ materially depending on the yield curve (which is subject to change as described above).
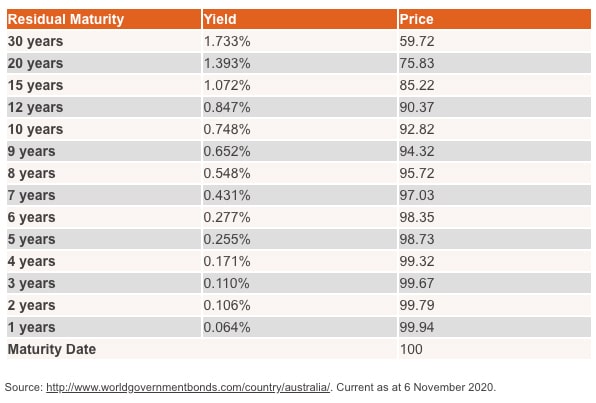
If an investor bought a 10-year bond at $92.82, and assuming the above yield figures remained the same, it would appreciate to $94.32 after a year (now a 9-year bond), a 12-month return of 1.62%, despite the quoted yield of 0.748%.
The excess return is roll return.
Conversely, if the investor bought a bond with two years to maturity for $99.79, after a year (when the bond becomes a 1-year bond) the value of the bond would have increased by 0.15%.
Put another way, if the investor bought a 10-year bond and held it to maturity, they would profit 7.48% over their holding period. However, these returns would not be evenly distributed over the ten-year period. 1.62% would have been made in the first year, and only 0.15% would have been made in the ninth year. As can be seen, roll return can have a material impact on total return.
In conclusion, investors can, depending on the shape of the yield curve, seek to harvest potential roll return by selling a bond before maturity and reinvesting in a longer-dated bond where the yield curve is steeper. This can be particularly important given the current scarcity of yield.
BetaShares has a range of rules-based bond ETFs incorporating investment strategies that take into account roll return on Australian corporate or government bonds.
BetaShares Australian Investment Grade Corporate Bond ETF (ASX: CRED) – provides exposure to a portfolio of senior, fixed-rate, investment grade Australian corporate bonds. Bonds held by the fund have a term to maturity of between 5.25 and 10.25 years.
| Yield to maturity2 | 1.96% p.a. |
| Estimated roll yield3 | 1.11% p.a. |
| Total expected return | 3.07% p.a. |
BetaShares Australian Government Bond ETF (ASX: AGVT) – provides exposure to a portfolio of high-quality, income-producing Australian Dollar-denominated fixed rate bonds issued primarily by Australian federal and state governments, supranationals, sovereign agencies and similar issuers. Bonds held by the fund have a term to maturity of between 7-12 years.
| Yield to maturity2 | 0.83% p.a. |
| Estimated roll yield3 | 1.01% p.a. |
| Total expected return | 1.84% p.a. |
1. Yield to maturity of Solactive Australian Government 7 – 12 Year AUD TR Index and Solactive Australian Investment Grade Corporate Bond Select TR Index as of 23 November 2020.
2. Total expected return is a forecast which assumes that absolute yields and the shape of the yield curve is unchanged over the next 12 months. However, these numbers, and the expected total return will vary over time. Does not take into account management costs of CRED or AGVT. As at 23/11/20. Source: Betashares.
3. Roll yields are estimated based on portfolio holdings as at 23/11/2020, where holdings weights in different bond maturity buckets are applied to the average duration of the sector or issuer curve. This assumes that the yield compression follows the current yield curve shape over the next 12 months. Does not take into account management costs of CRED or AGVT. Source: Betashares.


