Safety Concerns
We have written and spoken about the shortage of “safe havens” or high-quality assets in the world.
There exists an ever-pressing need for specific segments of the markets (pension funds, insurance companies, target date funds, etc.) to continue to own them and accumulate more.
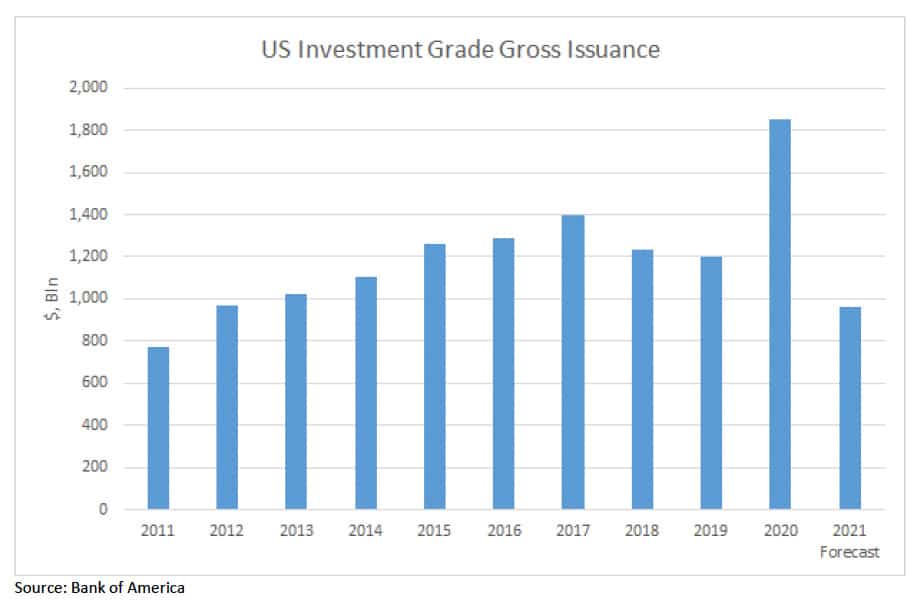
For more information, we can look at what is going on in what I’ll call “Investment Grade Land.” The chart below depicts what we’ve seen on a historical basis for investment grade (IG) gross issuance.
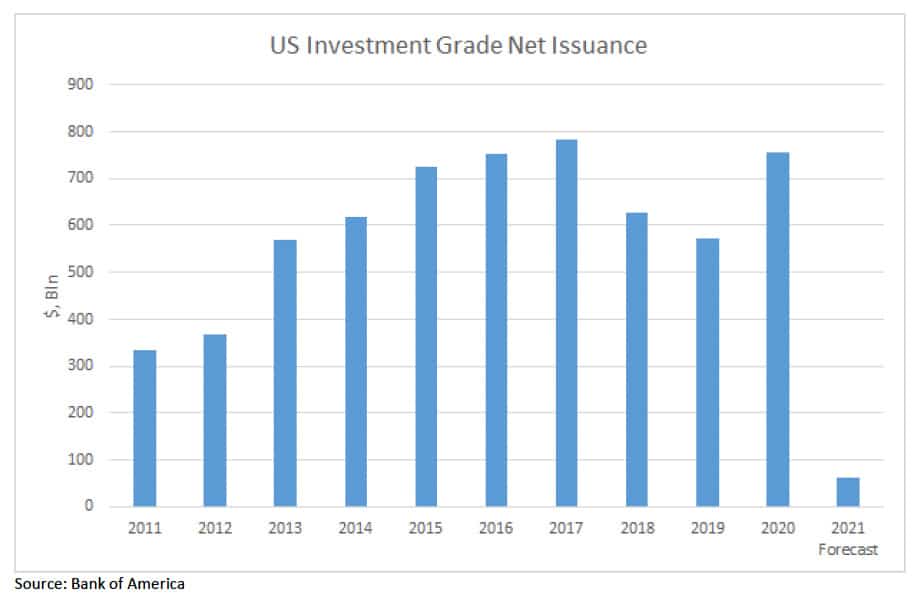
The below chart depicts IG net issuance, which takes into consideration what has been redeemed or bought back. Put another way, if a bond matures and a new one is issued to replace it, gross issuance reflects only the new issue side. It doesn’t take into consideration the idea that the original borrowing has essentially been extended. By contrast, net issuance numbers do account for this continued borrowing activity.
Pulled Forward
Forecasting supply is always a very tricky and imprecise endeavor, but the trend here is the key – note the massive drop-off in the 2021 forecast. Where 2020 saw a spike in gross issuance of 55%, with net issuance popping 32%, we now see a forecasted drop in gross issuance of 48% – 92% in net terms.
This makes sense. Why? Corporations rushed to shore up balance sheets and raise cash when the Fed backstopped the markets early in the pandemic. They issued bonds left and right and cash balances skyrocketed. In the simplest terms, corporations just pulled forward their issuance schedules to April and May of 2020.
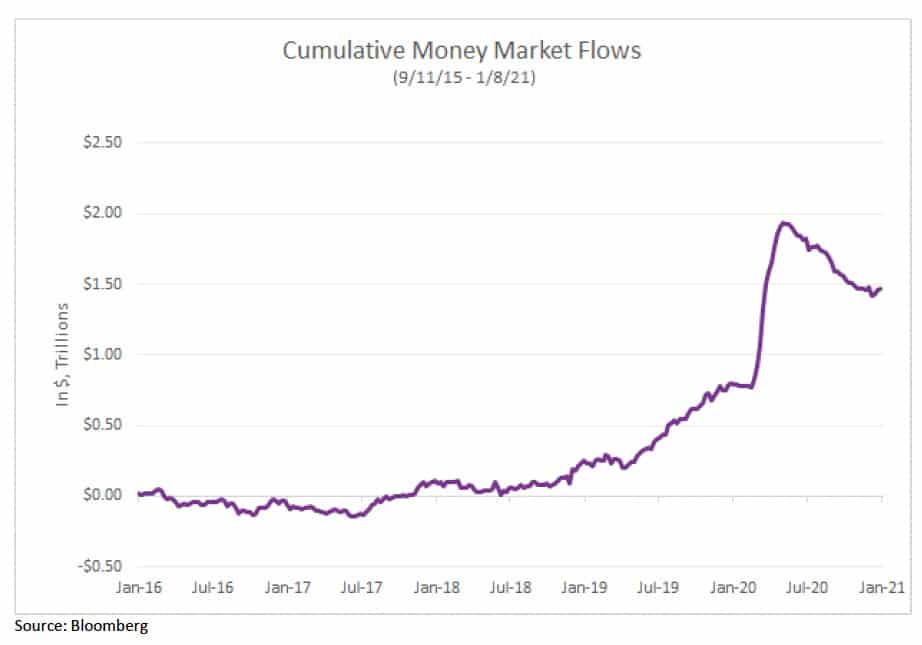
As a result, we saw over $1 trillion pile into money market funds from March to July. Some of this was newly raised corporate cash. Some of it was retail flows running for the hills. It should come as no surprise that IG issuers raised some $653 billion in gross supply (and $183 billion in net) during that period.
Now What?
Now, corporations are sitting on a lot of cash. What do they do? For starters, they’re not likely to issue more debt, unless for some reason they have to. They can buy back stock. They can buy back their debt.
They can use it for capital expenditures. They can look for mergers and acquisitions. You get the point.
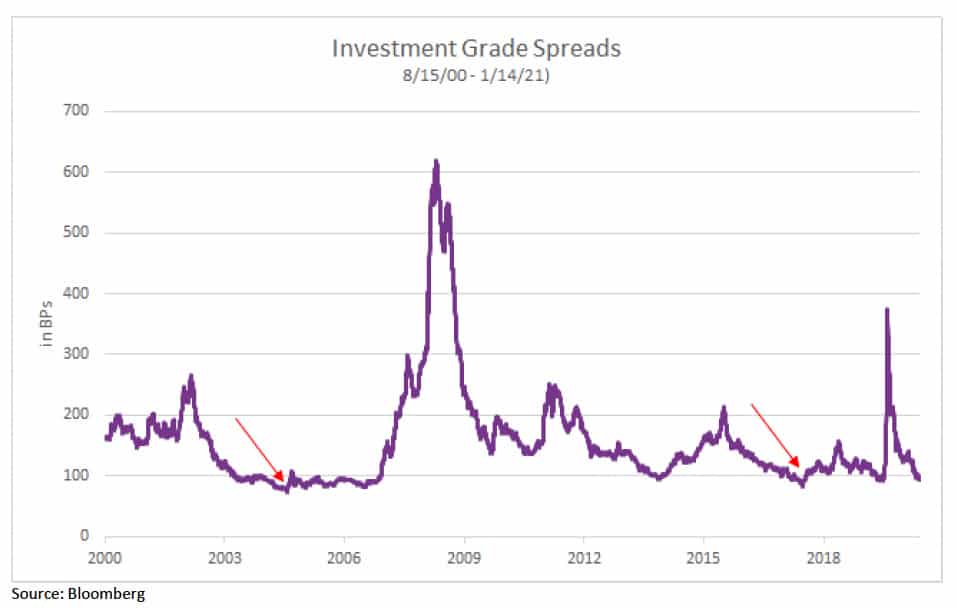
Now, let’s check out the historical spreads for IG – or the difference in yield between US Treasuries and IG over time within comparable maturities. We hit a pre-Global Financial Crisis low on March 11, 2005 of +76 basis points (see: the red arrow). We hit a post-Global Financial Crisis low on February 1, 2018 of +85 basis points (see: the other red arrow). As of this writing (January 15, 2021), we sit at +93 basis points.
The question is, are markets set to create an all-time new low? Given the supply and demand backdrop I outlined above, I would bet the answer is “likely, yes.” Coupled with an economic recovery that continues to slowly gaining speed on the back of the Covid-19 vaccine rollout, translating to better business fundamentals, the answer may even be “very likely, yes.”
While there certainly is duration risk in IG (the index is running at 8.74 years – gulp!), there is room for spreads to rally. So while a back-up in Treasury yields will work against IG, they can offset this with spread tightening amidst the backdrop outlined. It might not be a home run, and it might not be easy to swallow when you start with a yield-to-maturity on the index of 1.87% – but if you are in conversation with investors looking for quality fixed income, this is probably a story worth telling.
Supply and demand – this is what moves prices. By the looks of things, IG supply is going to be scarce in 2021 because it all got pulled forward into 2020 as a result of the pandemic and the Fed’s response. Demand is likely to only creep higher. This is the case for IG in 2021: supply < demand.


