By Sébastien Page, CIO and Head of Global Multi-Asset at T. Rowe Price
There’s no perfect historical analogy for the current environment. Fiscal and monetary institutions have changed, as have technology, geopolitics, and financial markets behaviour. Plus, the economy is still normalizing from the effects of unprecedented stimulus measures following the pandemic.
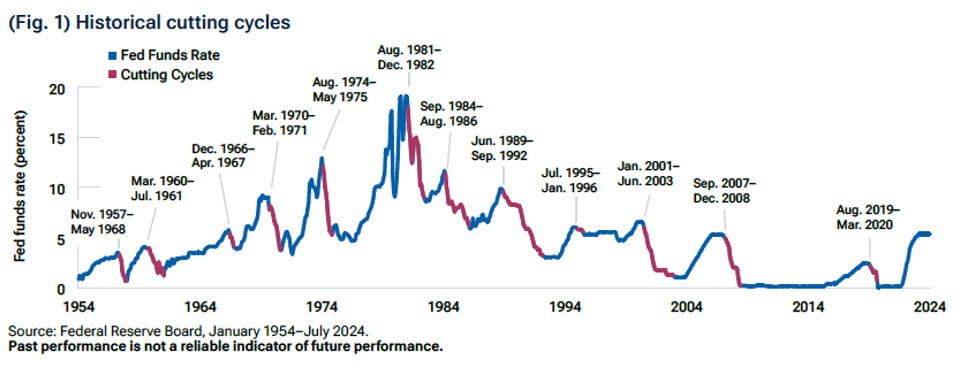
Still, we found commonalities across cutting cycles that could inform current asset allocation decisions. We studied 12 Fed cutting cycles spanning over 70 years, which are identified in red in the chart below.
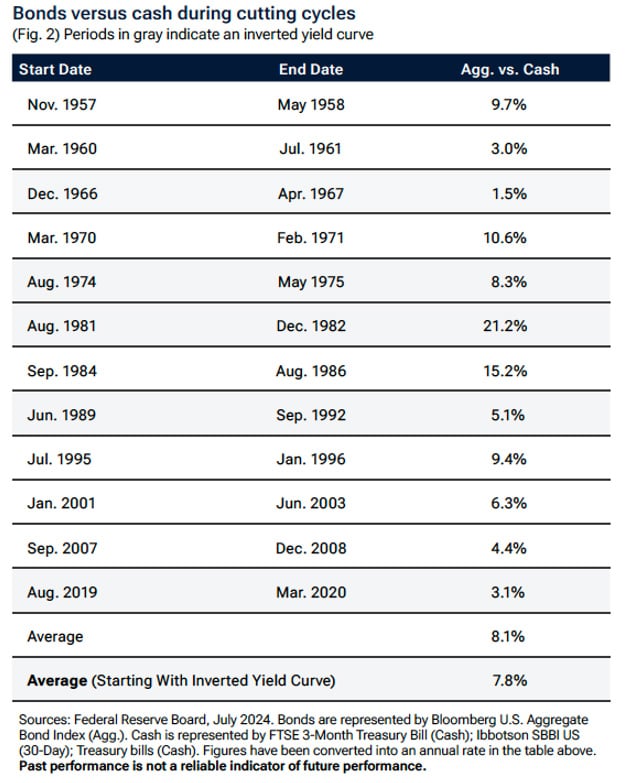
The most obvious takeaway is that bonds outperformed cash in all 12 cutting cycles, as shown below, by an average of 8.1% annualized.
And they outperformed when the yield curve was inverted at the start of five of the 12 cycles. Periods when the yield curve was inverted at the onset of Fed cuts are highlighted in grey. In those cases, bonds outperformed cash by an average of 7.8%.
So, my thinking is, let’s learn to love bonds again. This is not about stocks versus bonds. Rather, it’s about cash versus bonds. While past performance doesn’t tell us what will happen in the future, bonds could resume their role as diversifiers to stocks. I expect this as markets start responding more to growth scares than inflation risks.
I recognize this trade is a tough sell in the near term. At below 4%, the 10-year U.S. Treasury yield is near its lowest level in a year. If it continues to trade within a range, as it has for the last two years, its next trend could be higher, not lower.
However, long-term investors who are less sensitive to the entry point could phase in the trade. I expect Fed cuts to lower the range over time.
While the market has gradually priced out a few Fed cuts over the past few weeks, we still advise tactical investors to remain patient and wait for a further move up in yields as a better entry point – a potential last hurrah in the 10-year yield toward the range of 4.5%-5.0%, which we believe could happen around the election or following a geopolitically induced inflationary oil price shock. In addition, ongoing issuance by the US Treasury to fund the government’s deficit spending is flooding the market with new government bond supply, which could keep longer term yields at elevated levels over the next six months. Note that Fed’s quantitative tightening has taken a large, reliable buyer of Treasuries out of the market, further skewing the balance of supply and demand in favor of higher yields.
Also read: Time To Explore As The Traditional US Credit Market Reaches New Highs
For now, the 10-year yield is too low to justify moving money from cash to bonds, but based on our analysis of cutting cycles, we’re preparing for that scenario.
Other economic and investment takeaways aren’t as conclusive. On average, however, the Fed cut during economic slowdowns. Hence, during cutting cycles:
- Unemployment rose. The average increase in unemployment was 1.6%. It rose during 10 out of 12 cutting cycles.
- Inflation fell. The average decline in inflation was 1.7%. It declined during 10 out of 12 cycles.
- The equity risk premium compressed. The average outperformance of stocks over bonds across all 12 cutting cycles was 2.2%, annualized, with stocks outperforming bonds 58% of the time. Over the full sample (January 1940–July 2024), however, the average outperformance of stocks over bonds was 7.3%, annualized, with stocks outperforming bonds 70% of the time. (Stocks are represented by S&P 500 Index. Bonds are represented by the Bloomberg U.S. Aggregate Bond Index.)
- High yield (HY) bonds underperformed investment grade (IG). The average underperformance of HY was 7.2%. HY underperformed IG in four out of six cutting cycles (HY data start in 1983). In the full sample (August 1983–July 2024), HY outperformed IG by 2.4%, on average, 62% of the time. (High yield bonds are represented by the Credit Suisse High Yield Index. Investment-grade bonds are represented by the Bloomberg U.S. Aggregate Bond Index.)
Looking Forward
Which tactical asset allocation positions, besides the potential of bonds to perform better than cash, could outperform this time? To help us answer this, we need to forecast:
1. the direction of rates and
2. the sensitivity of asset classes to rates (i.e., their duration).
To generate alpha, tactical asset allocators must get both right.
The duration of stocks, for example, is a matter of debate. Declining rates should mean a lower discount rate on future cash flows (earnings) and thus rising valuations—resulting in a positive duration, correct? But what if rates decline because economic growth slows, which hits the expected value of future earnings and their growth rate? In this case, the empirical duration could be negative.
Or take small-cap stocks. Historically, they’ve had lower duration than the tech‑heavy, large-cap stocks. Tech companies’ cash flows typically extend further into the future, which means a higher sensitivity to the discount rate. But recently, due to their shorter‑term debt and higher leverage, small-caps have been more sensitive than large‑caps to changes in interest rates.
And here’s another duration distortion: Over the last year, growth stocks have become less sensitive to rate movements than value stocks, as growth stocks’ returns have been driven by artificial intelligence (AI) innovation. Empirically, their sensitivity to rates has flipped.
So many factors drive stock returns, not just interest rates. For many asset classes, isolating the effect of interest rates (i.e., estimating duration) is extremely difficult and requires judgment calls.
If you believe that rates are going down and want to add duration to your tactical asset allocation, you could add to the pairs with positive duration (long Treasuries versus the overall investment-grade market, for example) or reverse the pairs with negative bars (e.g. underweighting floating rate versus investment grade). Of course, as with any of these one-factor analyses, you should be aware of the influence of other factors that have been omitted, e.g., valuation, macro, and sentiment.


