


It’s tempting to assume that a bond with a yield of 6% will give a yield of 6% every year. But bonds usually give higher returns than their quoted yields early in their life, but lower yields later on. How a bond’s return can be expected to evolve depends critically on the shape of the yield curve. From Philip Brown, Head of Research, FIIG Securities.
Interest rate curve likely to steepen as RBA cycle begins

The timing is still not fully clear, but the RBA appears likely to begin an easing cycle sometime in early 2025. When the RBA starts to lower the cash rate, the shape of the interest rate curve in Australia will change.
As a general rule, very short-dated interest rates (1Y) will reflect the actual cash rate. Medium-length interest rates (3Y-5Y) tend to reflect the expectation of where the RBA will take interest rates in the future. Finally, the longer rates (7Y and more) stick closer to long-term averages and are less affected by developments in the cash rate. After all, the RBA rate next year is incredibly material for a 2Y bond, but far less important for an investment which is ten or even twenty years long.
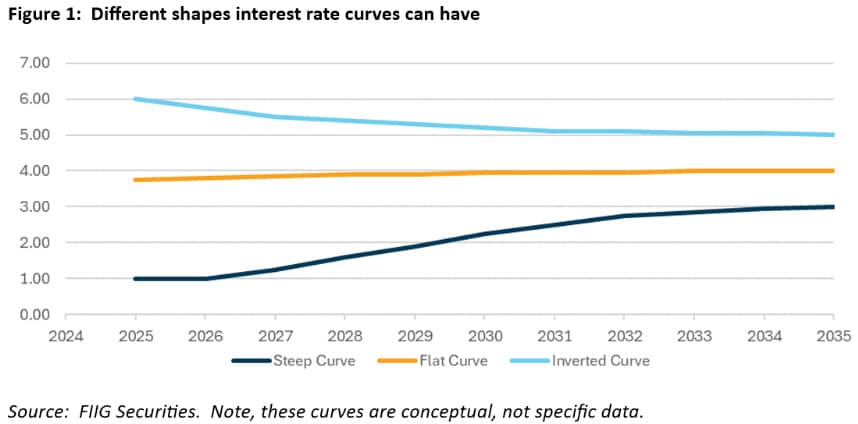
An upwards sloping or steep interest rate curve is the most common curve shape. It happens when the cash rate is either near average or lower than average. It is characterised by a low interest rate in the short-term, but has higher interest rates for longer dates. This can be either because of the expectation the RBA will raise rates in the future, or because higher yields are required to convince investors to make long-term investments (known as the term premium).
A flat curve usually occurs when the RBA is somewhat above the average rate. The flat curve, as the name suggests, is when interest rates are about the same for the entire length of the curve. Because the default shape of a curve is upwards sloping thanks to term premium, for a flat curve you normally need to have the RBA contemplating a mild rate cut cycle in the not-too-distant future. That allows the downwards slope of the anticipated rate cut cycle to offset the upwards slope of the term premium.
A fully inverted curve only happens when the RBA rate is very high and a rate cut cycle is assumed to be both imminent and large. The inversion happens because the expected rate cut cycle is large enough to overwhelm the effect of term premium.
Also read: An Eventful Quarter. Fixed Income Perspectives
Many RBA interest rate cycles end without a fully inverted curve. The Australian curve has been partially inverted for much of the last year or so, but it’s been only a partial inversion. The 3Y rate has been lower than the 1Y rate, but the longer part of the curve has remained upward sloping, giving the curve a shape reminiscent of the Nike “swoosh” symbol.
Now, as we approach the RBA rate cut cycle in 2025, the interest rate curve will likely steepen.
Returns are less straightforward when curves are steep
As the yield curve steepens, the quoted yields on long-dated bonds will drop, but less so than for the shorter-dated bonds.
However, also, as the yield curve steepens, the anticipated returns on long-dated bonds become trickier to understand.
Without going into too much detail, the term rate is the name given to the “standard” yield to a given term, while the forward rates are what you get if you break down that term yield into different segments.
Figure 2 shows the current risk-free swap rates out to 10Y as term yields as dark squares. The chart also shows various 1Y forward rates, which are the interest rates for the year indicated, across the length of the curve.
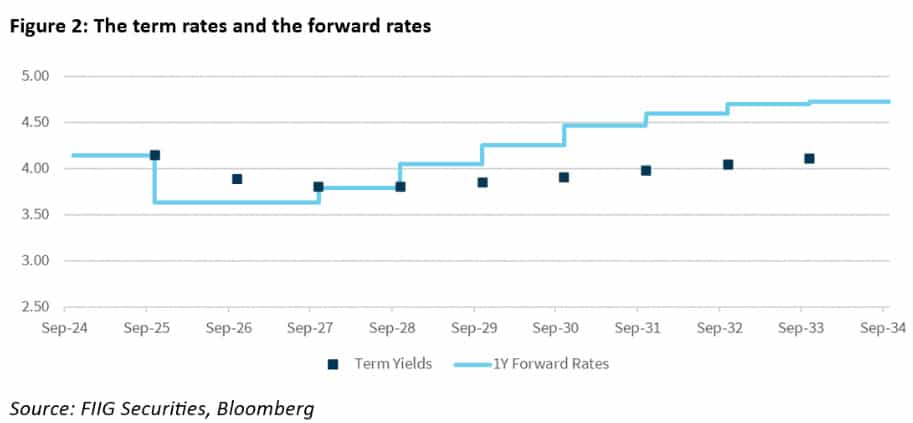
At present, for example, the 1Y swap rate is 4.14%, while the 1Y*1Y swap rate (the one-year rate in one year’s time) is 3.63%. This is driven by the market’s expectations that the RBA will start cutting rates very soon.
The two-year swap rate is 3.89%, which is the average of the 1Y rate of 4.14% and the 1Y*1Y rate of 3.63%.
The forward rates at the front part of the interest rate curve are largely driven by what markets perceive as the likely direction for the RBA interest rate over time. So, at a time like now, the fact that the RBA is expected to cut rates in the coming year means that the 1Y*1Y rate is lower than the current 1Y rate.
But, this understanding of the forward rates as RBA expectations breaks down in the longer part of the curve. Very few people would expect the RBA to slowly and consistently raise rates between 2025 and 2034 in a single unbroken movement. Yet that’s what the forward rates suggest in Figure 2.
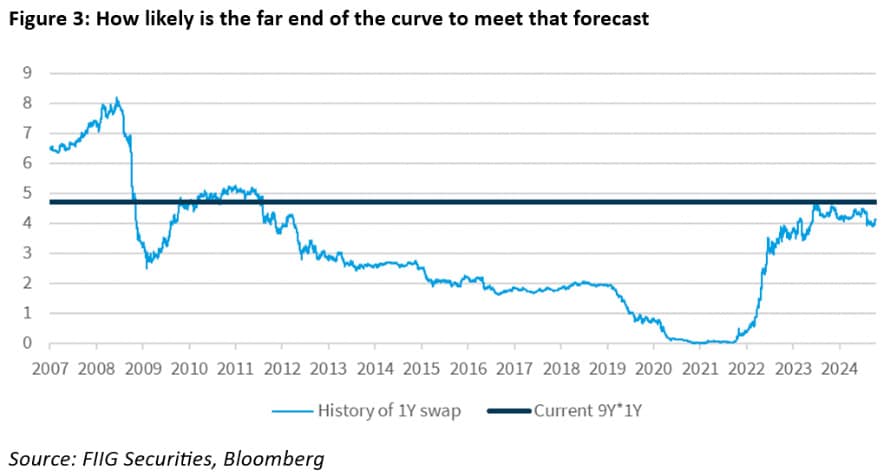
Indeed, the final 1Y yield assumed for 2034 is 4.73%. A look back at the history of the 1Y rate suggests that, since the GFC, the only times the 1Y swap rate has been above 4.73% are during the peak in rates in 2010 and – on and off – during the last year. So Figure 3 essentially says that the entire period 2031-2034 is going to look like the last year and be the very peak of a rate cycle. That doesn’t look terribly likely to us and, in fact, is not actually what is driving the forward rates in the long part of the curve. Instead, it is term premium that drives that high interest rate expected in the future.
Although the long part of the curve has forward rates that are not reflective of the likely cash rate, the shape of the forward curve drives how a bond performs over time.
Let’s look at the current curve and see how a bond priced at swap would evolve, assuming the forward rates don’t shift at all – that is, if the swap curve stays the same as it is today. If a 10Y bond was purchased, and interest rates evolved as expected, the bond would return much more than the quoted yield for the first few years, then less than the quoted yield for the middle and later part of its life, before rising again for the final year.
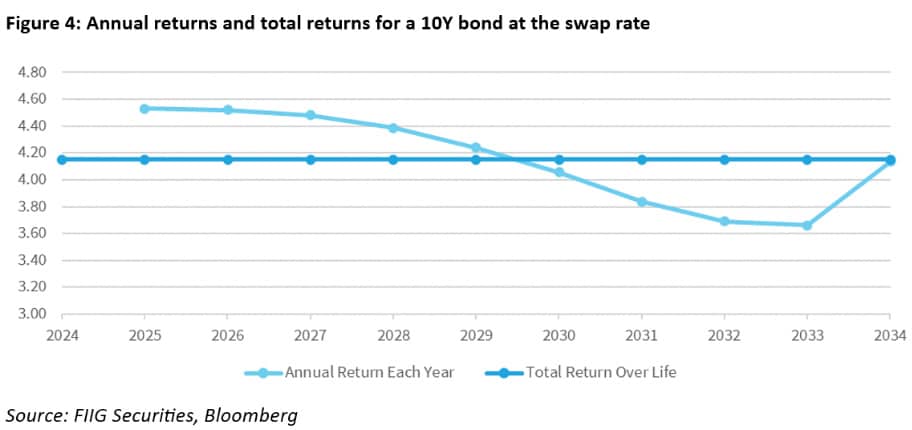
Notice that even though the current curve is not that steep, there is already a material difference between the expected return from a 10Y bond in the first year and the overall average return.
As the curve gets steeper this artifact of bond curves will only get stronger. The early returns from long bonds will be even more likely to be above their quoted whole-of-life yields. This method of investing is one reason why bond returns can be, reliably, larger than the total return on the portfolio. However, this style of investing does have risk because if interest rates change materially, the bond returns are affected.


")


 Platform To Digitally Trade Corporate Bonds")


