


This is an excerpt from Invesco’s Global Fixed Income Strategy Monthly Report, dated 31 March 2025, this part authored by Niklas Nordenfelt.
We believe income is a very attractive source of total return in the current environment, especially risk-adjusted. The evolving macro backdrop and uncertainty surrounding trade policies, geopolitical conflicts, and deficits have led to greater price volatility across both equity and bond markets. Income, however, is far less volatile and is higher today than most of the periods over the past two decades. High yield, as is often the case, offers one of the most attractive levels of income.
High income does not come without risk. This paper aims to put that risk into historical context. High yield has experienced a handful of large drawdowns throughout history and feels the impact of losses through defaults and restructurings. The magnitude of the drawdowns is often a function of the make-up of the market.
Below, we explain why today’s high yield market provides us with greater comfort that the downside risk is lower than it has been historically.
Sector composition
The high yield index is far more diversified across sectors than it has been in the past (Figure 1).
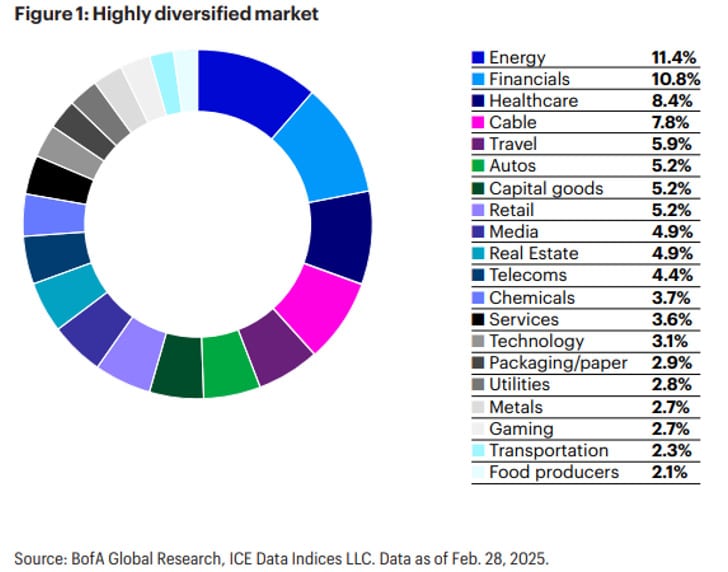
Today’s index better represents a cross-section of today’s economy, as opposed to mainly sectors undergoing secular challenges or areas favored for leveraged transactions. This is important because defaults have typically occurred among overleveraged companies or companies within sectors undergoing massive fundamental shifts.
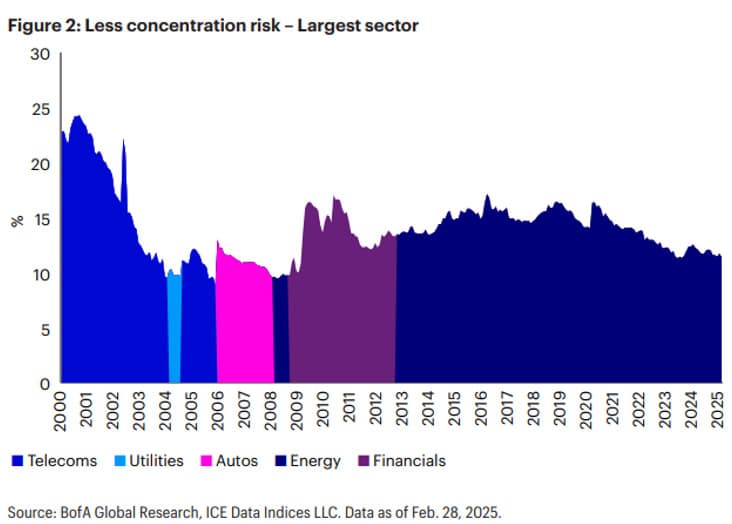
This was most evident during the drawdowns experienced in 2000 and 2015 when telecom and energy issuers defaulted in large numbers. Not coincidentally, those were the largest sectors in the index at those times.
Also read: Diversification: A Key Factor In Any Private Credit Discussion
Today, the largest sector is still energy, but it represents only 11% of the index, which is far lower than the 17% it represented when the sector collapsed on the back of precipitously falling oil prices in 2015. The telecom sector comprised nearly 25% of the index in the early 2000s.
Duration profile is shorter
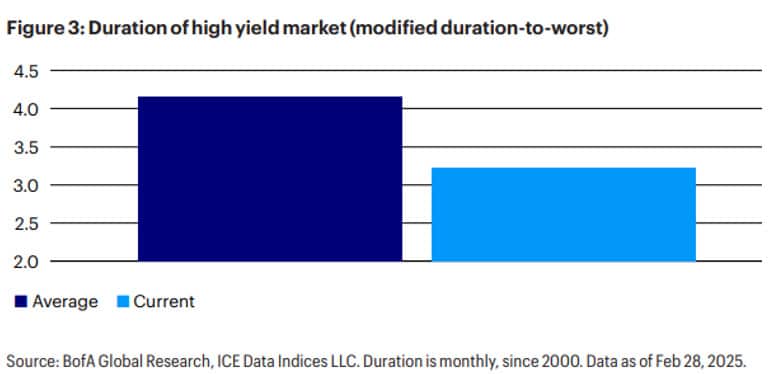
High yield’s duration has averaged about 4.2 years since 1996 (Figure 3). Today, the duration of the index is 25% lower, at around 3.2 years (Figure 3). The implication is that price volatility from sources unrelated to credit concerns, such as US Treasury volatility, should have less impact at this lower level of duration.
Quality profile has improved
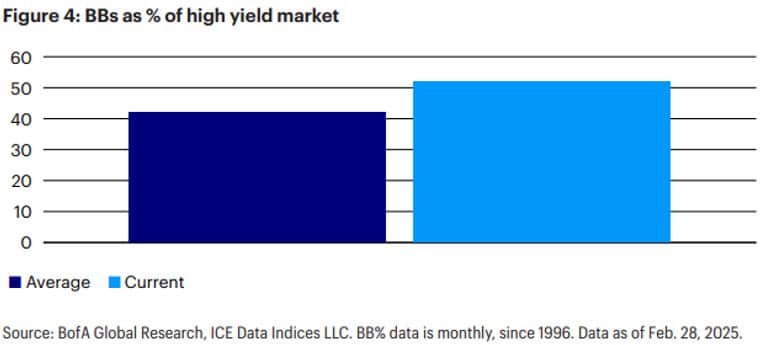
The average proportion of BBs in the high yield market averaged 42% from 1996 to the end of February (Figure 4). Today, that figure is 52%. Once again, the implication is for potentially less overall market volatility, because the index represents less credit risk and default risk, given the current cohort of issuers.
Seniority profile
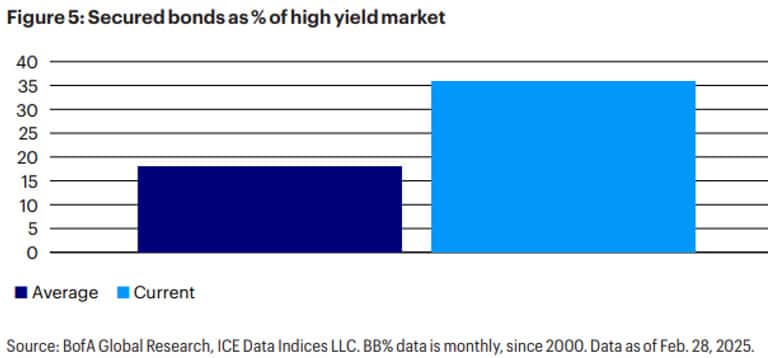
High yield has generally been populated by senior unsecured bonds since 2000. The average exposure of the index to senior secured bonds, on the other hand, has historically been only around 18% (Figure 5). In the past few years, a large number of secured bonds have been issued in the high yield market. Most were issued to refinance senior secured bank loans when it was more challenging to refinance in that market at attractive terms. As a result, today, nearly 36% of the high yield index is comprised of senior secured bonds (Figure 5).
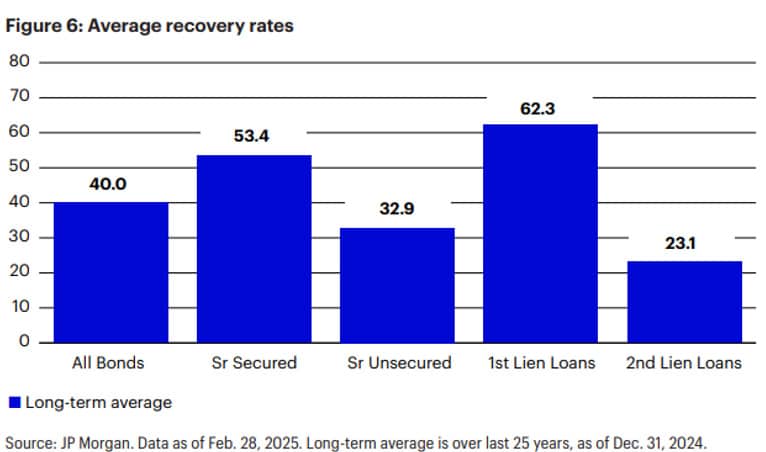
The implication of a higher proportion of secured bonds is that recovery rates in the case of default should be higher in the next default cycle. The average recovery rate for senior secured bonds has historically been 53% (Figure 6), which is comparable to first lien loans. This compares to a historical recovery rate of 33% on a typical high yield senior unsecured bond (Figure 6).
Healthy fundamentals
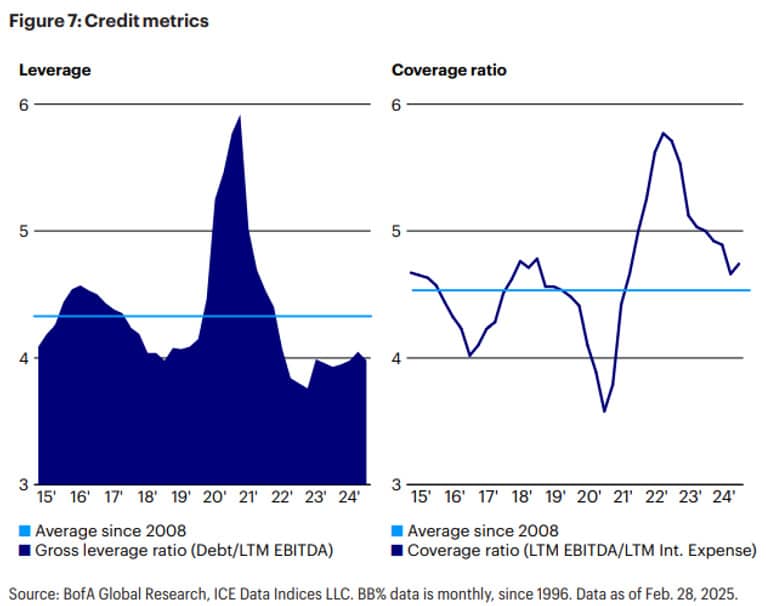
We feel current credit metrics provide a cushion to absorb a potential economic downturn. Credit metrics are on solid footing, with leverage below the historical average and interest coverage ratios well above the historical average.
Conclusion
Compared to the historical make-up of the high yield market, today’s market is higher credit quality, shorter duration, more senior, better diversified and on better fundamental footing. While this doesn’t guarantee protection from large drawdowns, it gives us considerably more comfort that this cohort of high yield issuers increases the probabilities that favor outcomes of less volatility, lower defaults and fewer realized losses. High income with potentially less erosion from defaults, and less volatility…what’s not to like?


")
 Asset Allocation Falls Out Of Fashion")


 Platform To Digitally Trade Corporate Bonds")


