


By Lukasz de Pourbaix
Head of Strategic Sales and Solutions, Fidelity International
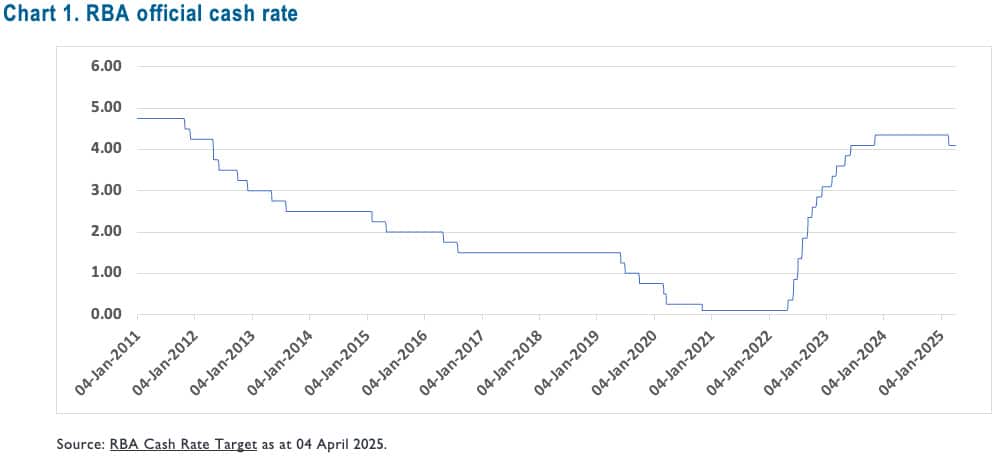
2022 was a pivotal year for Australian investors, signaling the first rise in the Reserve Bank of Australia (RBA) official cash rate since 2020.
As you can see in Chart 1, up until this point, investors had witnessed a steady decline in the official cash rate for over 10 years, going back to 2011.
Cash rates and bond yields fell to record low levels, pushing investors up the risk spectrum to generate higher returns. The incentive to invest in cash or bonds diminished with the RBA official cash rate hitting a low of 0.10% in 2020.
Fast-forward a couple of years and the economic environment changed dramatically. Rising inflation, fueled by pent-up savings and demand globally after the COVID pandemic, alongside Russia’s invasion of Ukraine, saw key central banks raise rates rapidly and aggressively.
For the first time in a while, cash offered a reasonable nominal return with the official cash rate reaching 4.35% in November 2023, and many term deposits offering rates of over 5%.
For many investors, cash made sense. Despite equity markets roaring ahead, high inflation and a general sense of geopolitical and market uncertainty saw cash balances materially rise.
On a global level, we have seen inflation moderate, which has led to various central banks, including the US Federal Reserve and European Central Bank, reducing their official cash rates. Likewise, here in Australia, in February the Reserve Bank made its first rate cut in three years. As cash rates fall, is now the time for investors to rethink their defensive portfolios?
As cash rates fall, the attractiveness of holding money in cash or short-dated investments such as term deposits will diminish and investors will need to consider whether they hold onto cash or seek out other investment opportunities across equities and fixed income assets.
Why duration, why now?
Constructing the defensive part of a portfolio requires a balance of generating yield with portfolio diversification and risk management.
It typically consists of three core building blocks of cash, duration (government bonds) and credit. The risk/return profile of these assets is broad, ranging from (risk-free) cash, and cash-like assets, through to assets such as high yield and emerging market debt, which generally offer high yields but at the same time behave more akin to equities from a risk/return perspective, given their higher correlation to equities.
One unloved segment of the fixed income market in recent years, which we believe is worthy of attention in the current environment, is duration fixed income assets.
The role of duration assets, such as global bonds or Australian bonds, within a diversified portfolio is primarily to serve as a diversifier to equities, as well as offering a reasonable level of yield.
In recent years, many investors have given up on bonds, as through the era of quantitative easing, bonds provided negligible yields when inflation rose rapidly. Bonds were also volatile and did not provide the diversification benefits to equities investors expected, leading many investors to question the role of bonds within their portfolios.
However, against this new economic backdrop, where inflation continues to moderate and interest rates are expected to fall over time, it may be an opportune time to consider an exposure to bonds for clients with little or no exposure.
There are three main reasons to consider bonds as part of a diversified portfolio:
1. Diversification
One of the key roles of bonds within a portfolio is to act as a ballast for a portfolio, providing diversification to equities. In the period where we saw market regimes shift from one of low rates, low inflation to higher rates and high inflation, bond market volatility increased materially as markets recalibrated to the new environment.
This saw equity/bond correlations increase, meaning that bonds did not provide protection against down periods in equity markets.
As inflation has moderated, we have seen volatility in bond markets subside and equity/bond correlations fall, thus improving the diversification benefits bonds offer against equities.
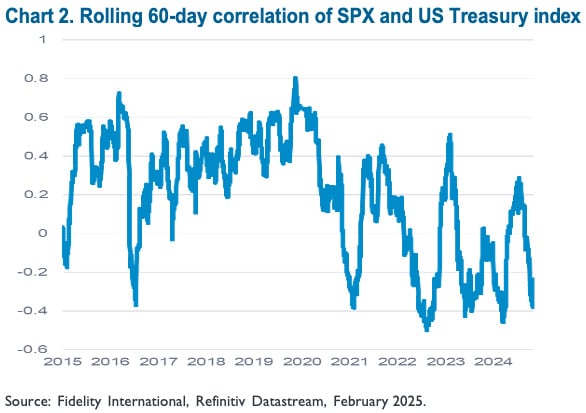
Chart 2 below shows the rolling 60-day correlation of the S&P 500 and US Treasuries. While correlations have been volatile, you can see that equity bond correlations have fallen materially as inflation has moderated, reaffirming the diversification benefits of bonds within a portfolio.
2. Yields and capital return
Bond yields have risen sharply since 2020. US 10-Year Treasury Bond Notes were yielding sub 1% pa in 2020 and are now yielding 4.33% pa at the time of writing this paper1.
If inflation moderates and interest rates continue to fall, duration assets including bonds should benefit from a capital returns perspective, as bond returns generally benefit from falling interest rates. Bond yields at such levels are comparable to cash rates.
3. Valuations
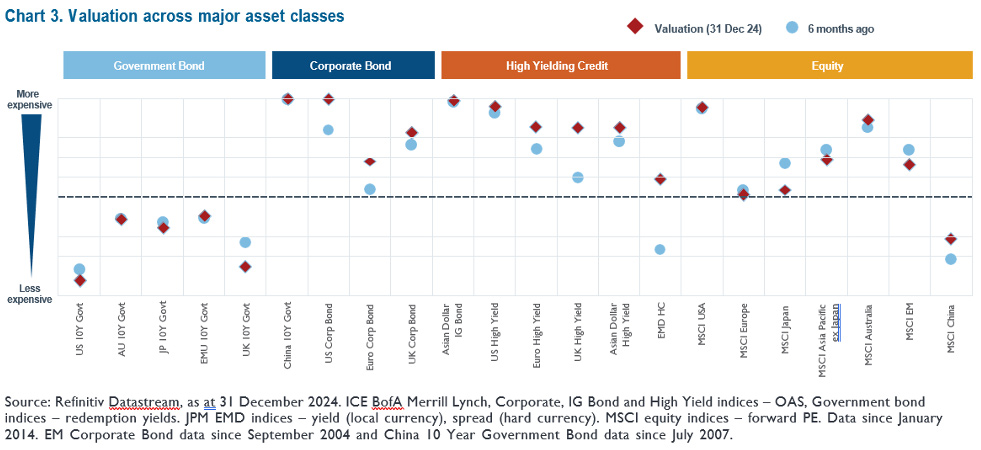
Bonds are also offering reasonable value relative to other parts of the fixed income universe. Assets like US Treasuries are trading at a significant discount compared to corporate bonds and high-yield assets.
While asset prices can remain elevated or depressed over the short to medium term, over the long term, valuation has proven to be an effective measure to assess the future value of an asset, i.e. buying quality assets at depressed valuation tends to be positive for long-term returns.
Chart 3 below shows the valuation of key asset classes as at 31 December 2024. Government bonds, such as US Treasuries, are trading at a material discount to other fixed income assets, such as corporate credit and high yield.
Time to review your defensive portfolio allocations
Cash and cash-like investments such as term deposits have provided investors with a solid return in recent years as interest rates have risen. Looking further ahead, if inflation continues to moderate it is likely we will see interest rates fall.
In this environment, while not a direct replacement for cash, bonds may play an increasingly important role within the context of a diversified portfolio as a source of yield, capital return and diversification. Now is the time to review your defensive portfolio allocations.
- 10-year US Treasury yield weekly average as of 31 March 2025.
All information is current as at 04 April 2025 unless otherwise stated. Not for use by or distribution to retail investors. Only available to a person who is a ‘wholesale client’ under section 761G of the Corporations Act 2001 (Commonwealth of Australia) (‘Corporations Act’). This document is issued by FIL Responsible Entity (Australia) Limited ABN 33 148 059 009, AFSL No. 409340 (‘Fidelity Australia’). Fidelity Australia is a member of the FIL Limited group of companies commonly known as Fidelity International. Prior to making any investment decision, investors should consider seeking independent legal, taxation, financial or other relevant professional advice. This document is intended as general information only and has been prepared without taking into account any person’s objectives, financial situation or needs. You should also consider the relevant Product Disclosure Statements (‘PDS’) for any Fidelity Australia product mentioned in this document before making any decision about whether to acquire the product. The PDS can be obtained by contacting Fidelity Australia on 1800 044 922 or by downloading it from our website at www.fidelity.com.au. The relevant Target Market Determination (TMD) is available via www.fidelity.com.au. This document may include general commentary on market activity, sector trends or other broad-based economic or political conditions that should not be taken as investment advice. Information stated about specific securities may change. Any reference to specific securities should not be taken as a recommendation to buy, sell or hold these securities. You should consider these matters and seeking professional advice before acting on any information. Any forward-looking statements, opinions, projections and estimates in this document may be based on market conditions, beliefs, expectations, assumptions, interpretations, circumstances and contingencies which can change without notice, and may not be correct. Any forward-looking statements are provided as a general guide only and there can be no assurance that actual results or outcomes will not be unfavourable, worse than or materially different to those indicated by these forward-looking statements. Any graphs, examples or case studies included are for illustrative purposes only and may be specific to the context and circumstances and based on specific factual and other assumptions. They are not and do not represent forecasts or guides regarding future returns or any other future matters and are not intended to be considered in a broader context. While the information contained in this document has been prepared with reasonable care, to the maximum extent permitted by law, no responsibility or liability is accepted for any errors or omissions or misstatements however caused. Past performance information provided in this document is not a reliable indicator of future performance. The document may not be reproduced, transmitted or otherwise made available without the prior written permission of Fidelity Australia. The issuer of Fidelity’s managed investment schemes is Fidelity Australia. © 2025 FIL Responsible Entity (Australia) Limited. Fidelity, Fidelity International and the Fidelity International logo and F symbol are trademarks of FIL Limited.


")


 Platform To Digitally Trade Corporate Bonds")